
The IRM Navigator™ Curve: A Faster Way to Classify Vendors and Clarify Your Risk Technology Roadmap
Most organizations still evaluate risk technology using surface features or maturity labels that do not reveal where a solution truly fits in the broader risk ecosystem. The IRM Navigator™ Curve provides a more reliable assessment. It combines the five IRM maturity levels with the four underlying investment domains to show how organizations advance from Risk Dysfunction to Risk Agency. This article introduces the curve in plain terms and provides a quick test that allows buyers to slot any vendor on the curve in less than two minutes.
Source: wheelhouseadvisors.com
The IRM Navigator Curve in One View
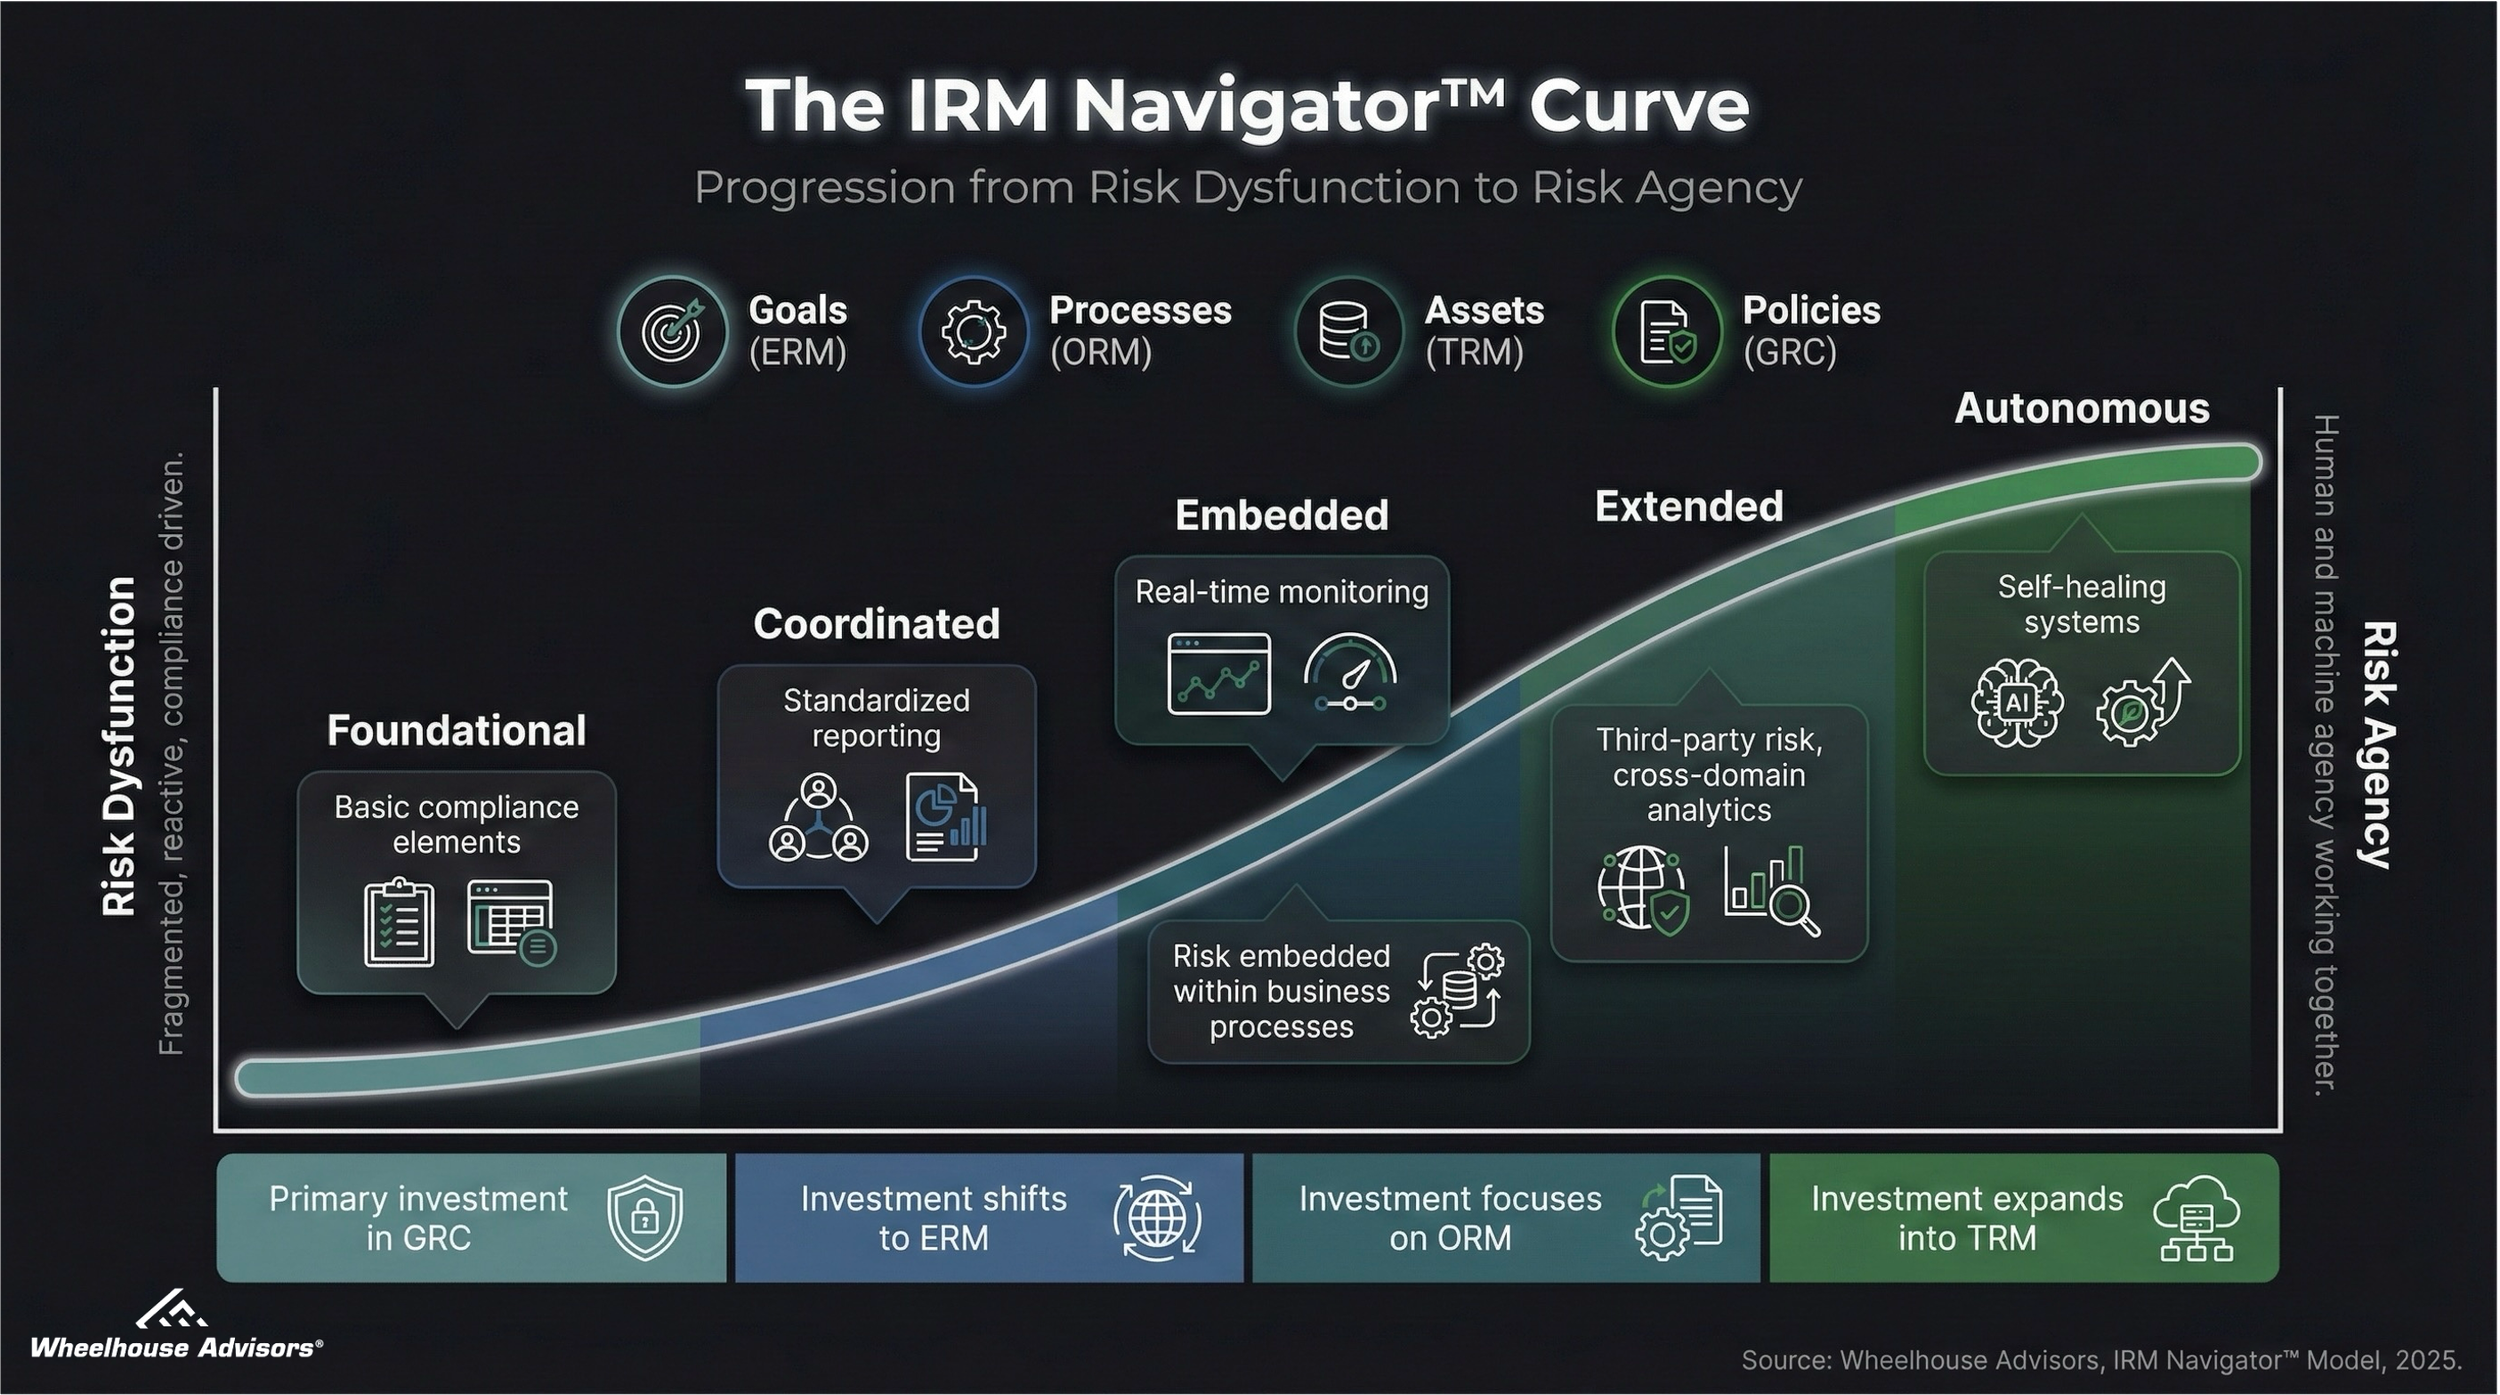
The IRM Navigator™ Curve represents the progression every organization follows as risk capabilities become more unified and technology investments shift from compliance instrumentation to intelligent and eventually autonomous risk management. It combines:
Five maturity levels
Foundational
Coordinated
Embedded
Extended
Autonomous
Four investment domains
Foundational to Coordinated: Concentrated investment in GRC
Coordinated to Embedded: Investment shifts to ERM
Embedded to Extended: Investment focuses on ORM
Extended to Autonomous: Investment expands into TRM
At the left side of the curve, risk activities are fragmented, reactive, and driven primarily by compliance. At the right side, human agency and machine agency operate together. Humans receive integrated visibility and decision support. Machine agents extend that agency by acting within validated guardrails. The curve illustrates that technology alone does not produce maturity. Progress requires the realignment of investment across risk domains and the integration of goals, processes, assets, and policies into a unified operating system.
Source: wheelhouseadvisors.com
The Quick Test to Slot Any Vendor on the Curve
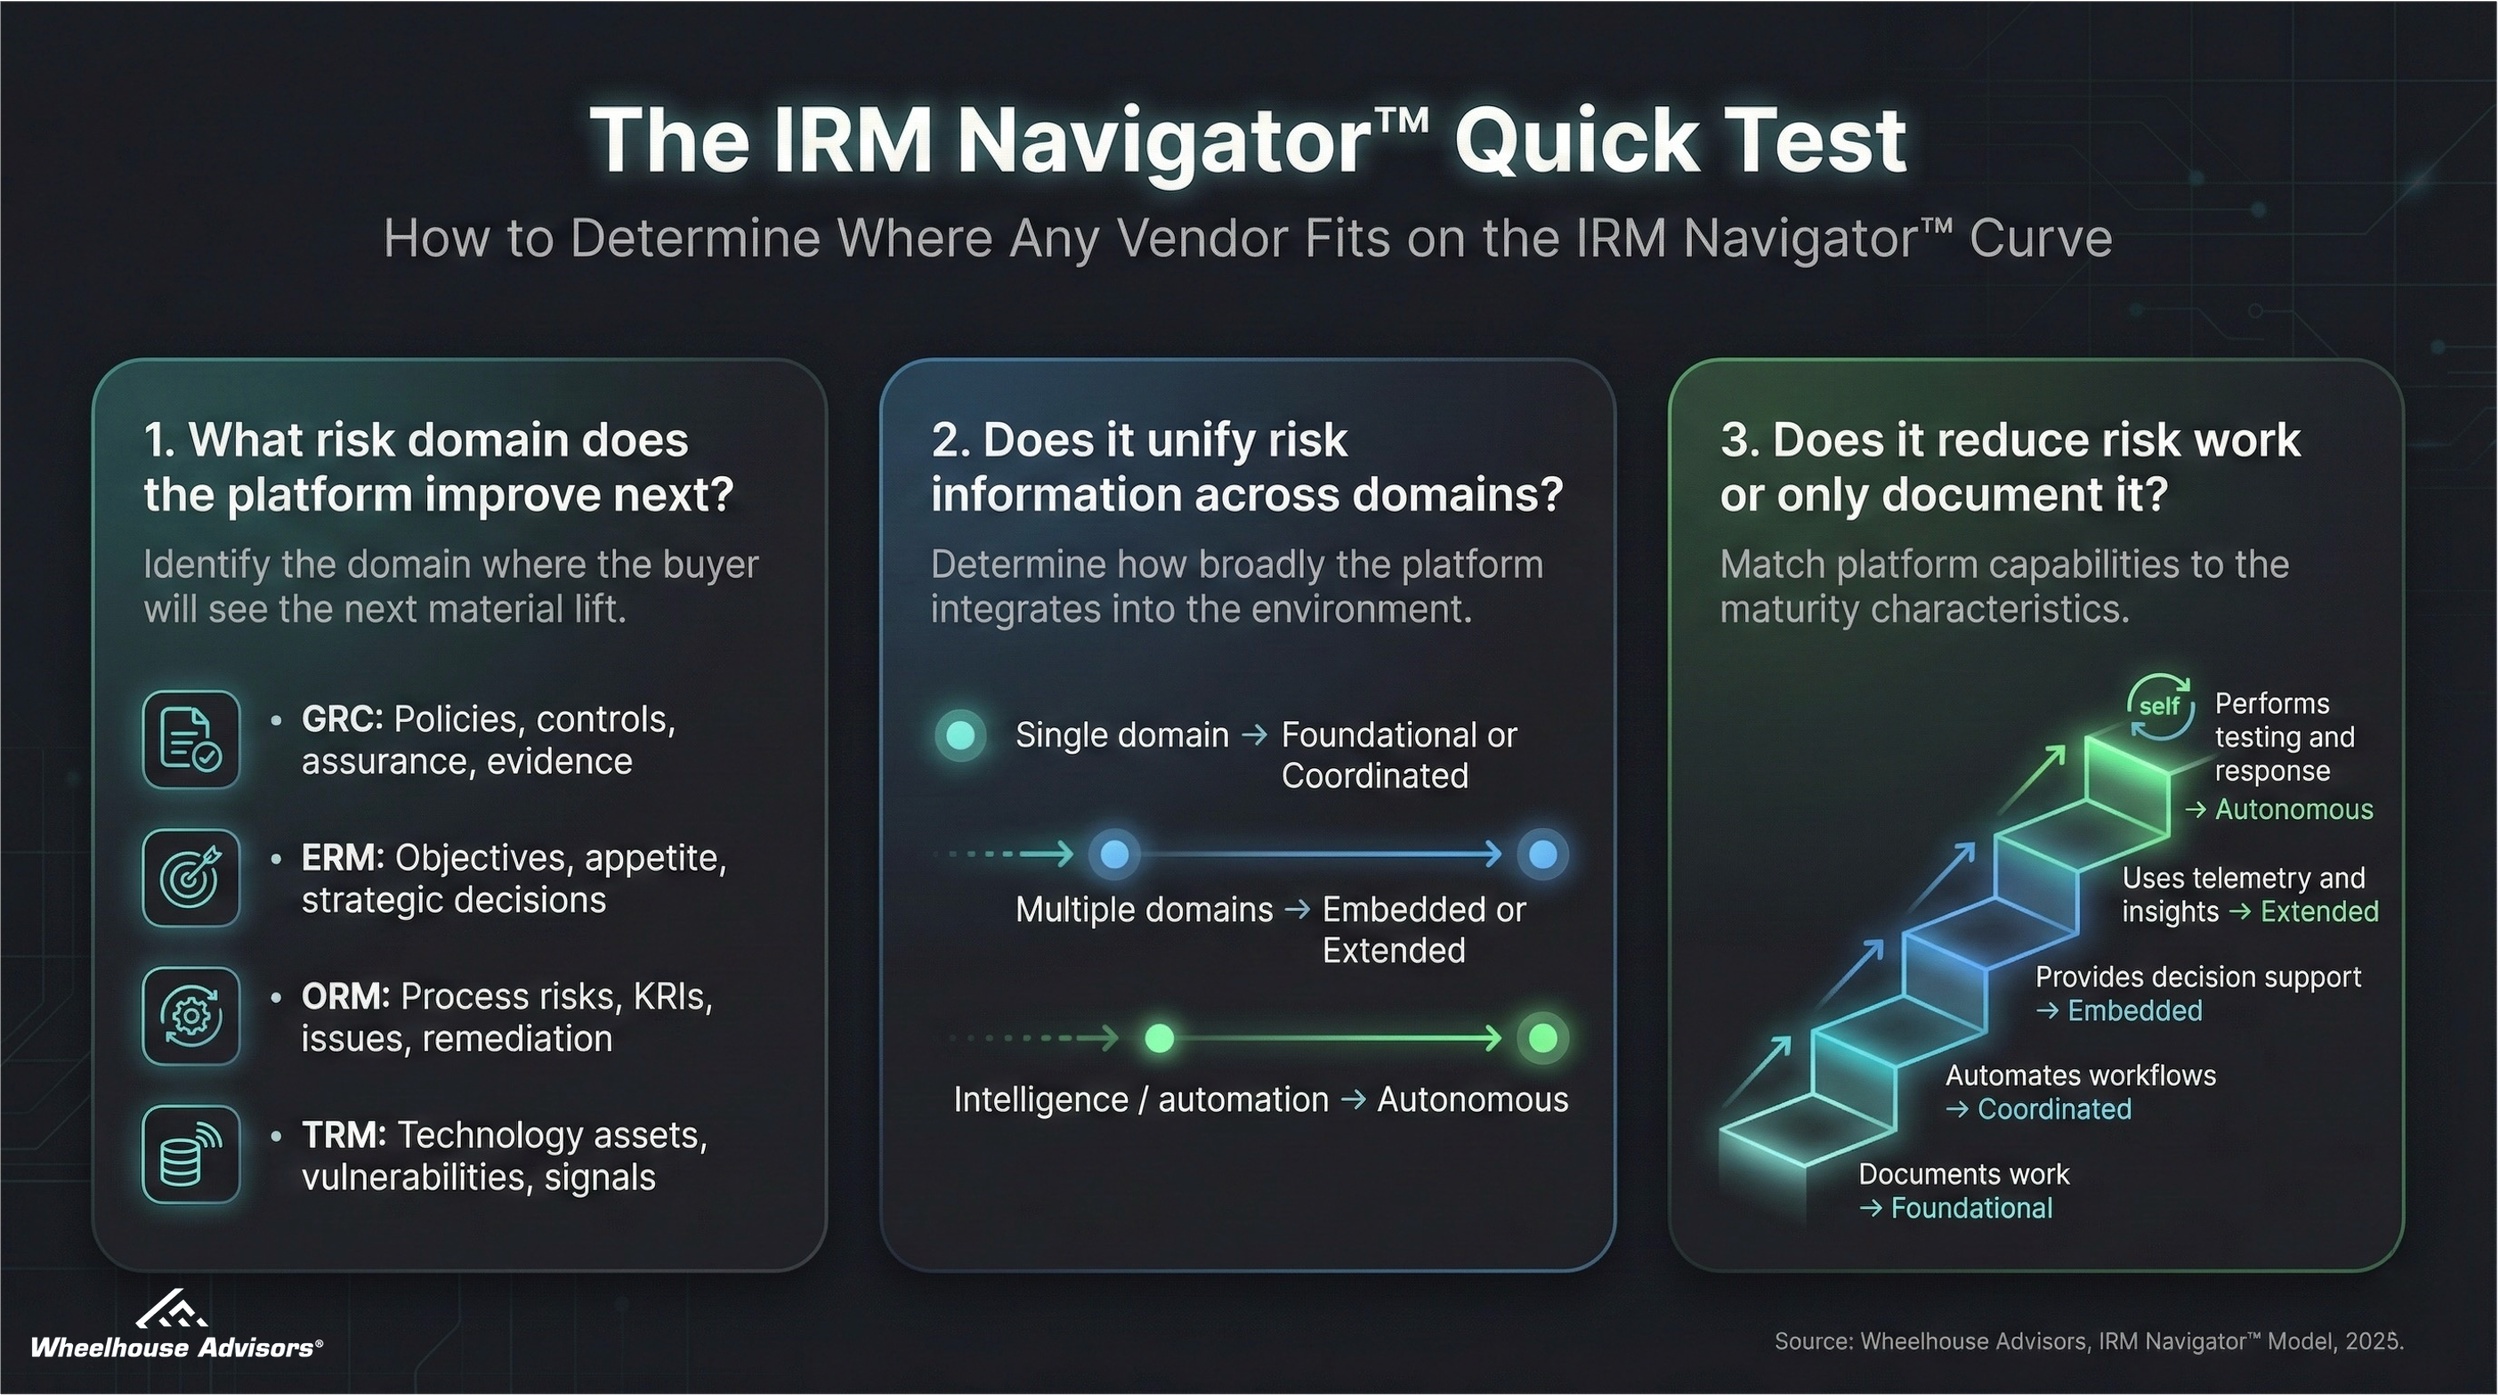
Buyers can classify any risk technology vendor on the IRM Navigator Curve by asking three questions. Each question corresponds directly to the maturity and investment dynamics of the curve.
Question 1: What risk domain does the platform improve next?
Identify the domain where the buyer will see the next material lift.
Policies, controls, assurance, evidence, attestations: GRC
Enterprise objectives, appetite, strategic risk decisions: ERM
Process risks, KRIs, issues, remediation, RCSAs: ORM
Technology assets, identities, vulnerabilities, vendor posture, signals: TRM
This determines the platform’s investment anchor on the curve.
Question 2: Does it unify risk information across domains or deepen silos?
If the platform improves a single domain, it fits in the lower two maturity levels, Foundational or Coordinated.
If it integrates across multiple domains in the buyer’s environment, it aligns with Embedded or Extended.
If it applies intelligence or autonomous validation, it aligns with Autonomous.
This determines maturity placement on the curve.
Question 3: Does the platform meaningfully reduce risk work or only document it?
Documentation only: Foundational
Workflow automation: Coordinated
Decision support: Embedded
Continuous telemetry and cross-domain insights: Extended
Machine-assisted testing and response: Autonomous
This determines capability depth relative to the curve’s rightward progression.
Interpreting the Result
Combine the three answers.
A platform that improves GRC, does not unify data, and largely documents work sits in Foundational.
A platform that advances ERM, unifies risk registers, and supports decision-making sits in Embedded.
A platform that advances ORM, strengthens process-level risk workflows, and integrates KRIs or remediation across business operations aligns with the Extended stage.
A platform that improves TRM, integrates telemetry, and automates validation sits in Autonomous.
The quick test removes guesswork. Two vendors with similar marketing messages can be separated immediately once the buyer identifies the next incremental investment gain and the degree of unification delivered.
Why This Matters
The risk technology market is crowded, and most buyers are overwhelmed by overlapping claims. The IRM Navigator Curve simplifies evaluation by tying all vendor capabilities back to a single question: Does the platform advance the organization toward Risk Agency or keep it in Risk Dysfunction? By placing vendors on the curve, buyers can construct a roadmap grounded in measurable progression and aligned with the organization’s goals, processes, assets, and policies.
Application in IRM Navigator Vendor Research
Organizations can also reference Wheelhouse’s Vendor Compass Series, which applies the curve and its evaluation criteria to assess GRC, ERM, ORM, TRM, and consulting providers across the IRM50.
References
Wheelhouse Advisors, IRM Navigator Research Series, 2025.
Gartner, Integrated Risk Management Definition, 2016. Gartner’s definition provides historical context for the shift toward unified risk approaches that later informed enterprise adoption patterns.
Forrester, Risk and Compliance Technology Landscape, 2024. The landscape highlights the fragmentation of risk and compliance tools and confirms the market complexity buyers face when evaluating overlapping categories.